Open Provenance Model Contents
- Introduction
- Basics
- Overlapping and Hierarchichal Descriptions
- Provenance Graph Definition
- Timeless Formal Model
- Inferences
- Formal Model and Time Annotations
- Time Constraints and Inferences
- Support for Collections
- Example of Representation
- Conclusion
- Best Practice on the Use of Agensts
- References
3 Overlapping and Hierarchichal
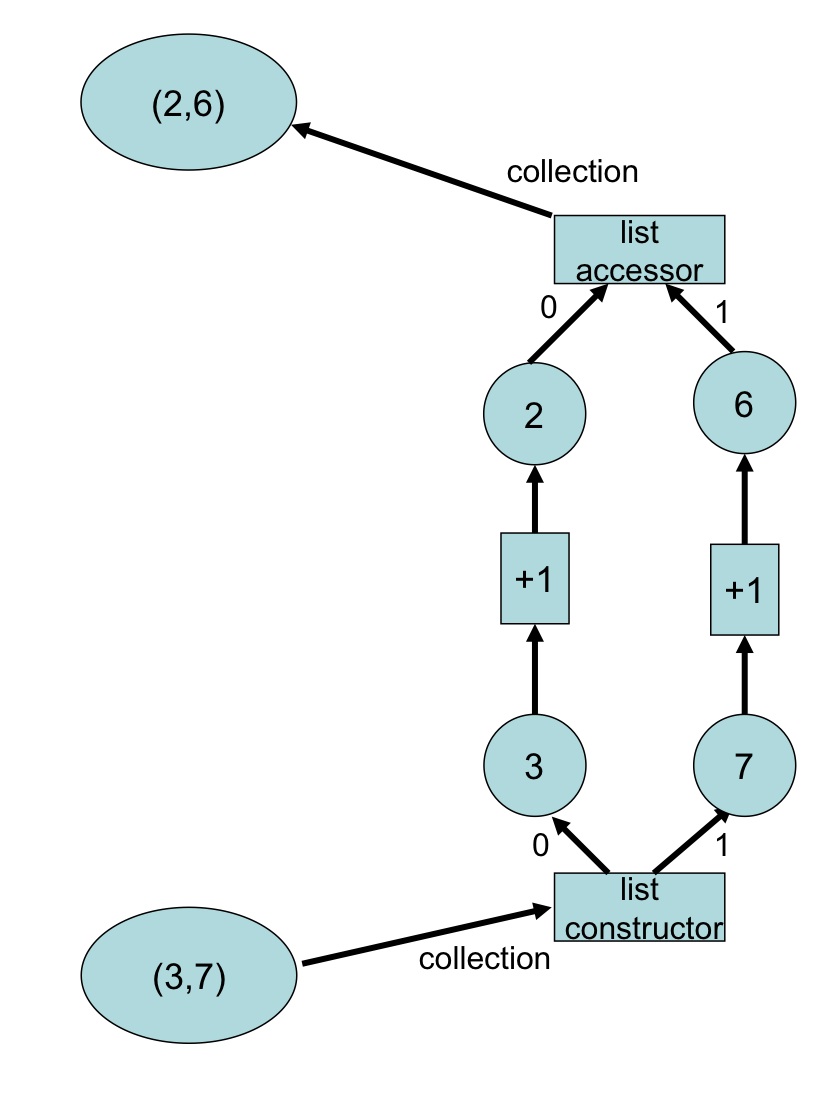
Figure 4 shows two examples of provenance graphs describing what led the list (3,7) to being as it is. According to the left-hand graph, the list was generated by a process that added one to all constituents of the list (2,6). According to the right-hand graph, the derivation process of (3,7) required the list to be created from values 3 and 7, respectively obtained by adding one to 2 and 6, themselves being the data products obtained by accessing the contents of the original list (2,6).
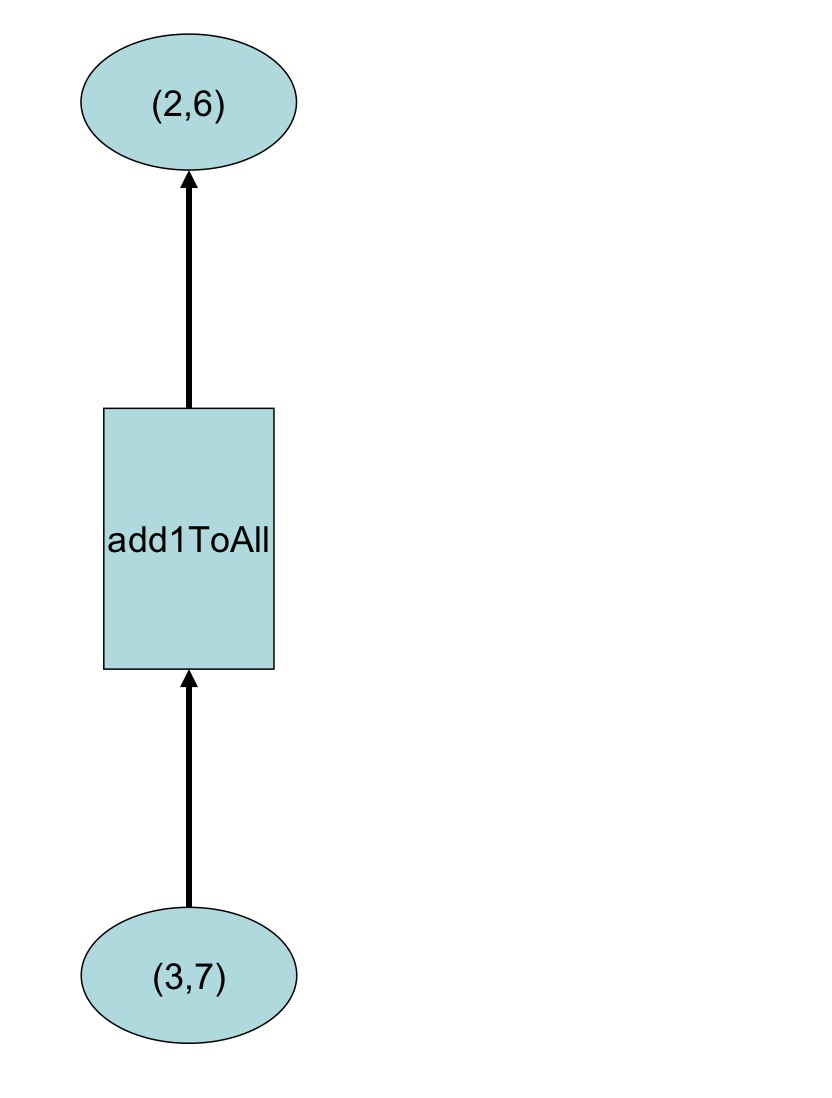
Figure 4: Examples Provenance Graph
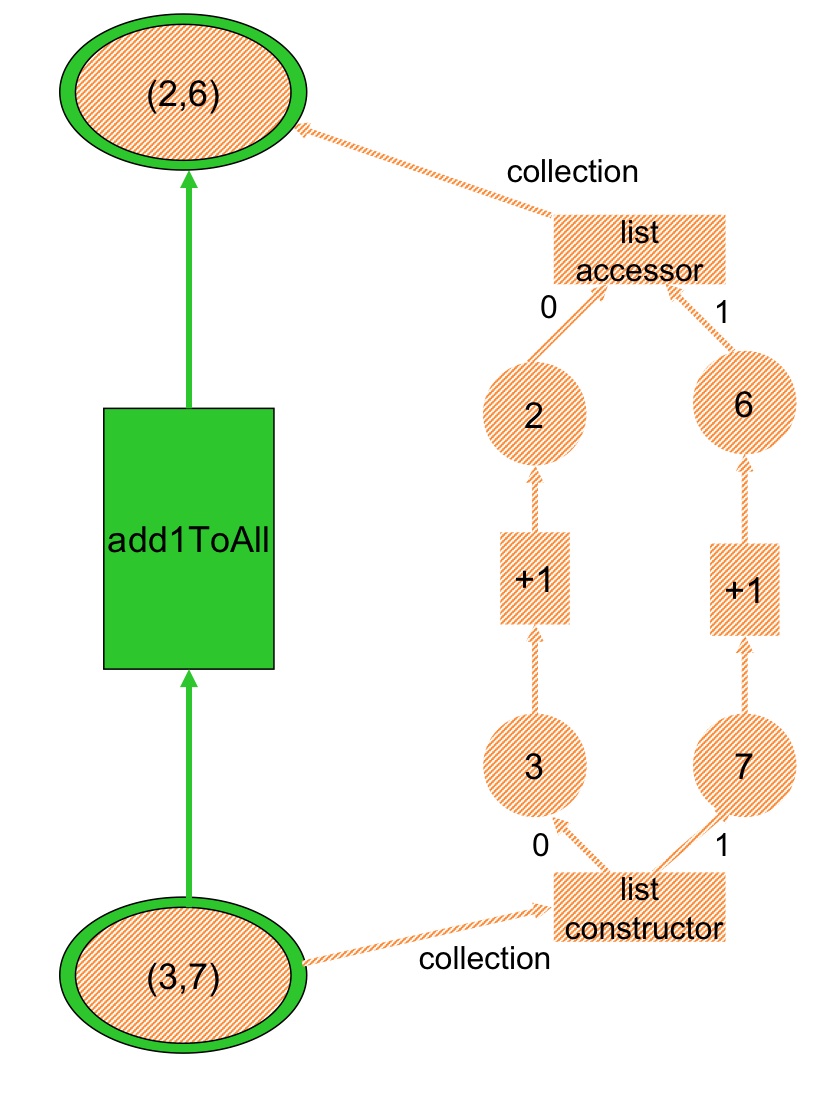
Assuming these two graphs refer to the same lists (2,6) and (3,7), they provide two different explanations of how (3,7) was derived from (2,6): these explanations would offer different levels of details about the same derivation. The requirement of providing details at different levels of abstraction or from different viewpoints is common for provenance systems, and hence, we would expect both accounts to be integrated in a single graph. In Figure 5, we see how the two provenance graphs of Figure 4 were integrated, by selecting different colors for nodes and edges. The darker (green) part belonged to the left graph of Figure 4, whereas the lighter (orange) part is the alternate description from the right graph of Figure 4. (Graphs in this paper are better viewed in color.) The darker and lighter subgraphs are two different overlapping
accounts of the same past execution, offering different levels of explanation for such execution. Such subgraphs are said to be
overlapping accounts because they share some common nodes (2,6) and (3,7). Furthermore, the lighter part (orange) provides more details than the darker subgraph (green): the lighter part is said to be a
refinement of the darker grapher.
Figure 5: Example of Overlapping and Hierarchical Accounts in a Provenance Graph
Observing Figure 5, it becomes crucial to contrast the edges originating from
artifact (3,7) with those originating from the list constructor process. Indeed, the
used edges out of the list constructor process mean that
both artifacts 3 and 7
were required for the process to take place. On the contrary, since the edges out
of artifact (3,7) are colored differently, they indicate that alternate explanations
exist for the process that led to such artifact being as it is. Using the analogy 11
of AND/OR graphs, a process with used edges corresponds to an AND-node,
whereas an artifact with
wasGeneratedBy edges from different accounts represent
an OR-node.
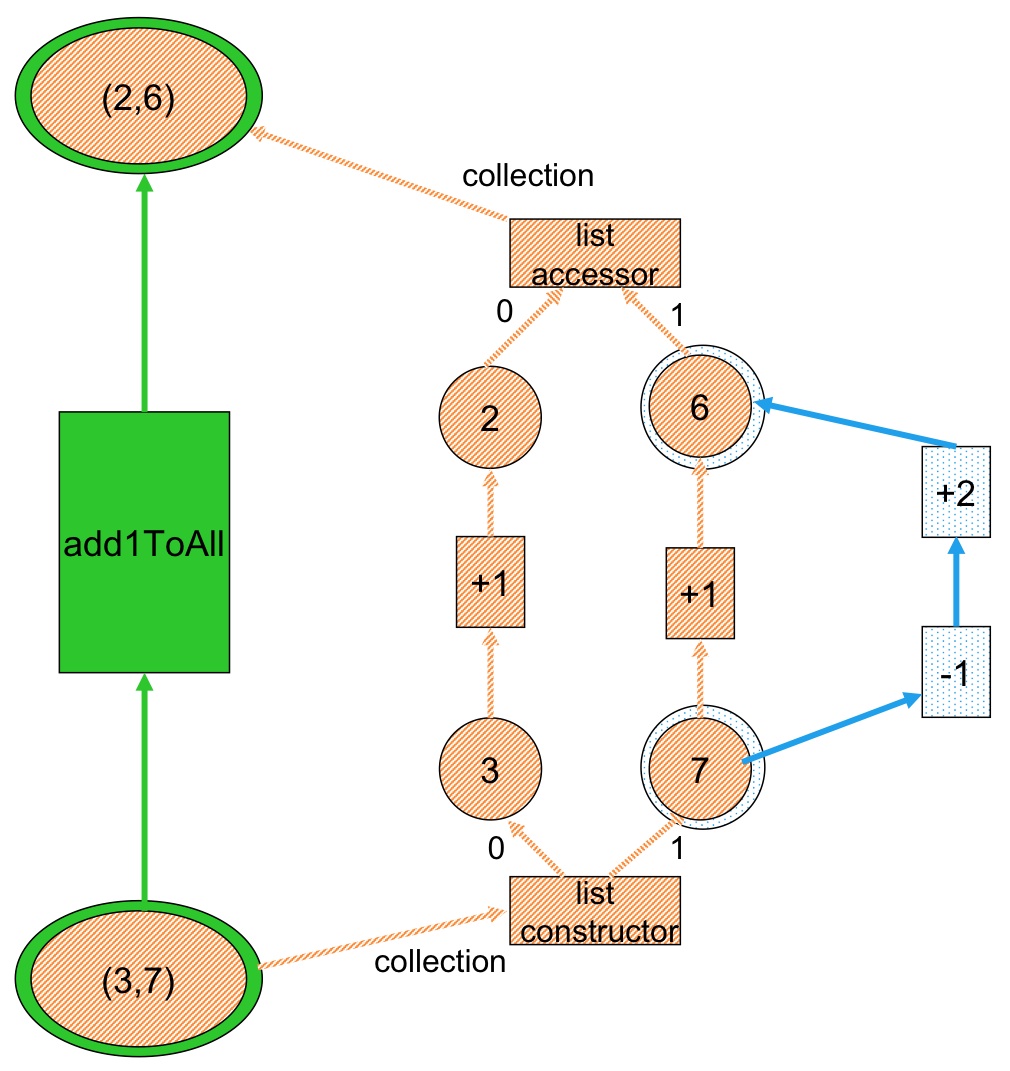
It is possible to use refinements repeatedly to create a hierarchy of accounts,
as illustrated in Figure 6. We see that a third account (blue) is introduced, to
explain how one of the +1 processes was performed.
Figure 6: Hierarchy of Accounts in a Provenance Graph
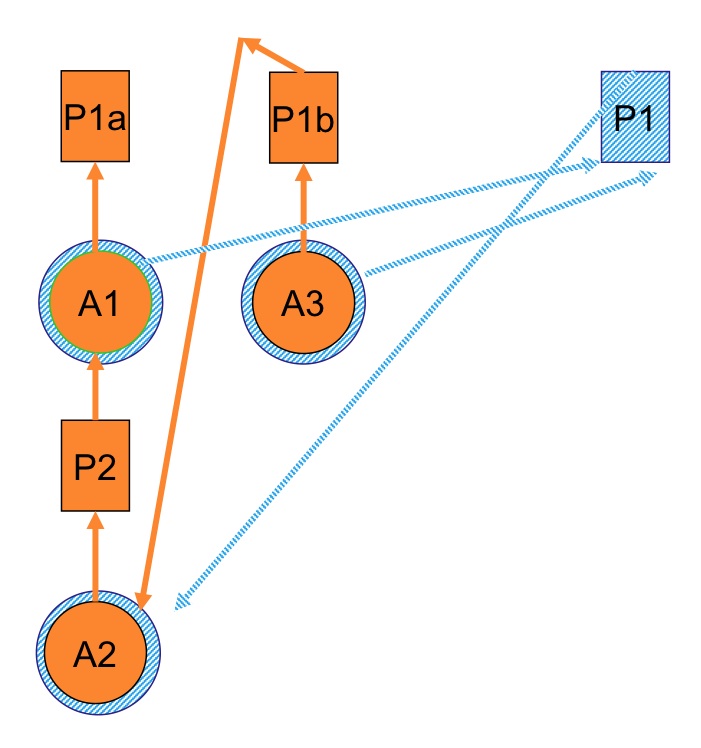
By combining several accounts, we can obtain cycles, as illustrated by Figure
7. Here, in the first view (darker, orange account), a description of two
processes P1a and P1b is presented, and their dependencies on artifacts A1, A2
and A3. In the second view (lighter, blue account), it is stated that the two
processes P1a and P1b are in fact a single process operating on input A2 and
producing A1 and A3. If we combine the two views, a circle has been created:
A2 → P2 → A1 → P1 → A2.
Figure 7: Multiple Accounts Creating Cycle
While overlapping accounts are intended to allow various descriptions of a same execution, it is recognized that these accounts may differ in their description's semantics. In general, such semantic differences may not be expressed by structural properties we can set constraints on in the model (beyond the constraints identified in this document).
Comments
to top